Here is a chart of all homes for sale, pending for sale, and sold in Portland, Oregon for the last 15 months:

Homes for sale (Inventory):
Up 17% compared to last month.
Down 14.3% compared to last year.
Home sales closed:
Up 7.8% compared to last month.
Down 13.1% compared to last year.
Homes pending:
Up 5.8% compared to last month.
Up 3.3% compared to last year.
Chart for average price per square footage:
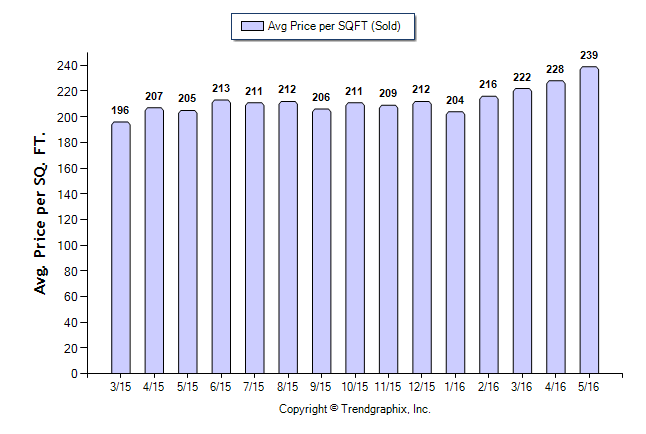
Price per Sq. Foot in Portland, OR:
Up 4.8% compared to last month.
Up 16.6% compared to last year.
Days on market and sold/list price %:

In May 2016, sellers were getting, on average, 103% of their original asking price.
Average Days on Market:
Down 9.1% from last month.
Down 33.3% from last year.
Sold/Original List Price Ratio:
Up 1% from last month.
Up 2% from last year.
Average price for sale vs. average price of sold:

In May, 2016, the average price of a home that sold was $458,000. The average price of a home that was listed was $603,000. This does not mean that a home that was listed for $603,000 sold for $458,000. The listed homes didn't necessarily sell. For the sold/list price percentage average, look at the 'Days on Market' graph. In May 2016, this figure was 103%.
Average Price of a Home Listed:
Down 2% from last month.
Up 14.2% from last year.
Average Price of a Home Sold:
Up 6.8% from last month.
Up 17.7% from last year.
Months of inventory:
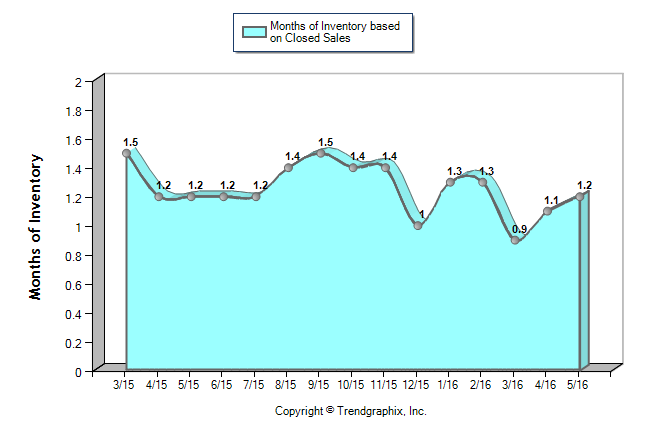
Months of inventory gives a timeline of how long it would take for all of the current listings to sell. Anything above 6 months is considered a buyer's market, 3-6 Months is a balanced market, below 3 months is a seller's market. In May 2016, this figure was 1.2 months based on closed sales. This does NOT mean that it will take, on average, 1.2 months for your home to sell. That number was, on average in all price ranges, 20 days. It means that, if not a single new listing were to come on the market in Portland, it would take 1.2 months for all available homes to sell before there would be none left. It is a very strong seller's market.
Months of Inventory Based on Closed Sales:
Up 9% from last month
No change from last year
Months of Inventory Based on Closed Sales:
Up 9% from last month
No change from last year
This is a comparison of the past 15 months (including a percentage change analysis for the last 12 months) for all of Portland and are taken directly from the RMLS. What follows is my own analysis of these statistics. For our purposes, I thought it best to analyze Portland as a whole. Each neighborhood, however, is a little micro-universe and has its own market. Changing the parameters of the zip codes, price variables, or time periods can lead to very different results. This analysis is of all homes sold in all price ranges in Portland, Oregon. If you have any questions about specific zip codes, or any questions about the market in general, please reply to this forum with those questions or feel free to contact us.
This information doesn't matter if you have a particular neighborhood in mind since Portland neighborhoods are their own micro-markets. If you have one in mind to buy or are selling your home, please request a report for that neighborhood and I am happy to send it to you.
Search all listings in Portland on our website:
No comments:
Post a Comment