So, what's going on this month? It is still an extreme seller's market out there with historically low inventory. Demand is through the roof while supply is low. However, in our own business, we are seeing some changes. Regarding homes for sale, we have received far more listing calls this year than the past two years, indicating to me that sellers are starting to feel that the time is finally right to sell. They all seem ready to go active in June or July. Many, but not all, of these sellers calling us are actually moving OUT of Portland. We are still getting calls from growing families needing more room or people looking to downsize but am noticing some are leaving town for new jobs elsewhere or to be closer to family out of state. Regardless, I expect a busy Spring and Summer 2016 and hope to help bring many more properties to market to bring happiness to struggling buyers looking for their new home.
As far as buyers are concerned, we are going into BATTLE for them! We are still finding multiple offers on most, but not all, properties we are writing on. We have developed a list of non-monetary terms to include in an offer that are helping us win these competitive situations but they are competitive nonetheless. When they don't work out, we pick ourselves up, dust ourselves off, and go for the next one!! Nothing feels better than winning these for our buyers, though!
When I say 'but not all' it is because there are still deals to be had in Portland if you are flexible and not needing to be in walking distance of a Salt and Straw or Barista or other bastion of Portlandia hipness. Trust me, though, they are both worth the bike ride (I can't say car-drive in Portland or my cred will be diminished. I just can't have that. You understand.).
Looking at the chart below, you will see the details of the market. I like my clients to actually see what I'm describing and not just take my word for it. I plan on updating this every month so keep checking back. If you wish, I can also provide you with market reports for single neighborhoods (Alameda? Montavilla? Pearl?) or even specific types of properties (condos? Detached single family?). Just let me know what you are interested in and I will send a personalized market report to you. I'm a nerd for this stuff so don't hesitate to ask. Now, I will finally shut up and bring you the data:
Here is a chart of all homes for sale, pending for sale, and sold in Portland, Oregon for the last 15 months:

Homes for sale (Inventory):
Down 5.5% compared to last month.
Down 40.2% compared to last year.
Home sales closed:
Down 7.1% compared to last month.
Down 4.9% compared to last year.
Homes pending:
Up 23% compared to last month.
Up 11.2% compared to last year.
Chart for average price per square footage:

Price per Sq. Foot in Portland, OR:
Up 4.9% compared to last month.
Up 13.8% compared to last year.
Days on market and sold/list price %:
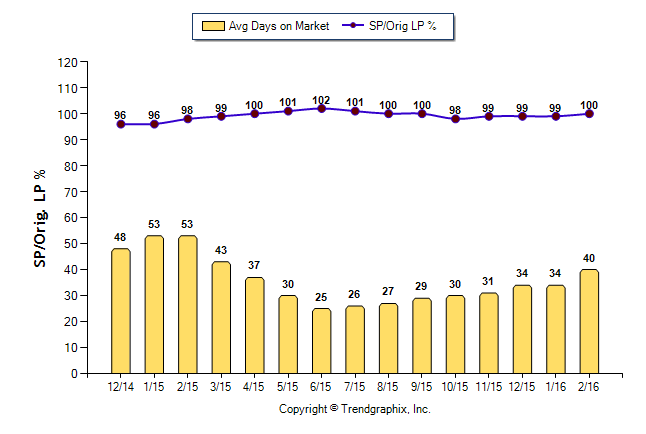
In February 2016, sellers were getting, on average, 100% of their original asking price.
Average Days on Market:
Up 17.6% from last month.
Down 24.5% from last year.
Sold/Original List Price Ratio:
Up 1% from last month.
Up 2% from last year.
Average price for sale vs. average price of sold:

In February, 2016, the average price of a home that sold was $391,000. The average price of a home that was listed was $608,000. This does not mean that a home that was listed for $608,000 sold for $391,000. The listed homes didn't necessarily sell. For the sold/list price percentage average, look at the 'Days on Market' graph. In February 2016, this figure was 100%.
Average Price of a Home Listed:
Up 3.4% from last month.
Up 24.1% from last year.
Average Price of a Home Sold:
Up 0.5% from last month.
Up 9.5% from last year.
Months of inventory:

Months of inventory gives a timeline of how long it would take for all of the current listings to sell. Anything above 6 months is considered a buyers market. In February 2016, this figure was 1.4 months based on closed sales. This does NOT mean that it will take, on average, 1.4 months for your home to sell. That number was, on average in all price ranges, 40 days. It means that, if not a single listing were to come on the market in Portland from this moment, it would take 1.4 months for all available homes to sell before there would be none left.
Months of Inventory Based on Closed Sales:
Up 7.4% from last month
Down 36.8% from last year
Months of Inventory Based on Closed Sales:
Up 7.4% from last month
Down 36.8% from last year
This is a comparison of the past 15 months (including a percentage change analysis for the last 12 months) for all of Portland and are taken directly from the RMLS. What follows is my own analysis of these statistics. For our purposes, I thought it best to analyze Portland as a whole. Each neighborhood, however, is a little micro-universe and has its own market. Changing the parameters of the zip codes, price variables, or time periods can lead to very different results. This analysis is of all homes sold in all price ranges in Portland, Oregon. If you have any questions about specific zip codes, or any questions about the market in general, please reply to this forum with those questions or feel free to contact us.
This information doesn't matter if you have a particular neighborhood in mind since Portland neighborhoods are their own micro-markets. If you have one in mind to buy or are selling your home, please request a report for that neighborhood and I am happy to send it to you.
Search all listings in Portland on our website:
No comments:
Post a Comment